Close
Home
About Greatship
About Us
Vision & Values
Management
Corporate Governance
Policies
General Meetings
Disclosures
Fleet
Rigs
350-ic-ju-rigs
Ships
Anchor Handling Tug Supply Vessels
Platform Supply Vessels
R-Class Supply Vessels
Multi-Purpose Supply and Support Vessels
People
People
Recruitment
Drilling
Logistics
Corporate
QHSE
QHSE
QHSE Statistics
Drilling
Logistics
Financials
Financials
Annual Reports
2025
2024
2023
2022
2021
Media
News Archive
2023
2022
2017
2016
2015
Contact Us
Greatship Companies
Contact Us
Singapore
UK
Great Eastern Shipping
Search
Home
About Greatship
Vision & Values
Management
Policies
Fleet
350-ic-ju-rigs
Anchor Handling Tug Supply Vessels
Platform Supply Vessels
R-Class Supply Vessels
Multi-Purpose Supply and Support Vessels
People
Drilling
Corporate
Logistics
QHSE
Drilling
Logistics
Financials
2021
2020
2019
2018
2017
Media
Contact Us
Singapore
Great Eastern Shipping
Home
About Greatship
About Us
Vision & Values
Management
Corporate Governance
Policies
General Meetings
Disclosures
Fleet
Rigs
350-ic-ju-rigs
Ships
Anchor Handling Tug Supply Vessels
Platform Supply Vessels
R-Class Supply Vessels
Multi-Purpose Supply and Support Vessels
People
People
Recruitment
Drilling
Logistics
Corporate
QHSE
QHSE
QHSE Statistics
Drilling
Logistics
Financials
Financials
Annual Reports
2025
2024
2023
2022
2021
Media
News Archive
2023
2022
2017
2016
2015
Contact Us
Greatship Companies
Contact Us
Singapore
UK
Great Eastern Shipping
Menu
Home
About Greatship
About Us
Vision & Values
Management
Corporate Governance
Policies
General Meetings
Disclosures
Fleet
Rigs
350-ic-ju-rigs
Ships
Anchor Handling Tug Supply Vessels
Platform Supply Vessels
R-Class Supply Vessels
Multi-Purpose Supply and Support Vessels
People
People
Recruitment
Drilling
Logistics
Corporate
QHSE
QHSE
QHSE Statistics
Drilling
Logistics
Financials
Financials
Annual Reports
2025
2024
2023
2022
2021
Media
News Archive
2023
2022
2017
2016
2015
Contact Us
Greatship Companies
Contact Us
Singapore
UK
Great Eastern Shipping
Search
Financials
Home
About Greatship
Vision & Values
Management
Policies
Fleet
350-ic-ju-rigs
Anchor Handling Tug Supply Vessels
Platform Supply Vessels
R-Class Supply Vessels
Multi-Purpose Supply and Support Vessels
People
Drilling
Corporate
Logistics
QHSE
Drilling
Logistics
Financials
2021
2020
2019
2018
2017
Media
Contact Us
Singapore
Great Eastern Shipping
Key Figures
Annual Reports
2025
2024
2023
2022
2021
Key figures
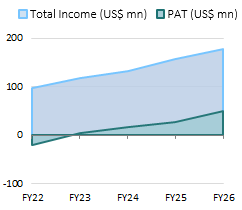
P&L Account data
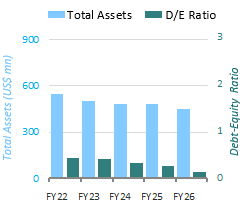
Balance Sheet data
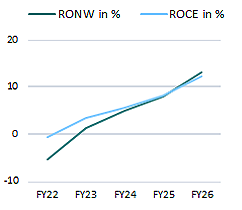
Financial Returns data